Rhodes74
Et voilá, i knew you were hooked!
Btw, did you calibrate the signals with some headroom? The partial white-outs at low freq/ high volume appear to indicate a saturation. But maybe i am misinterpreting…
-Rhodes74

Et voilá, i knew you were hooked!
Btw, did you calibrate the signals with some headroom? The partial white-outs at low freq/ high volume appear to indicate a saturation. But maybe i am misinterpreting…
-Rhodes74
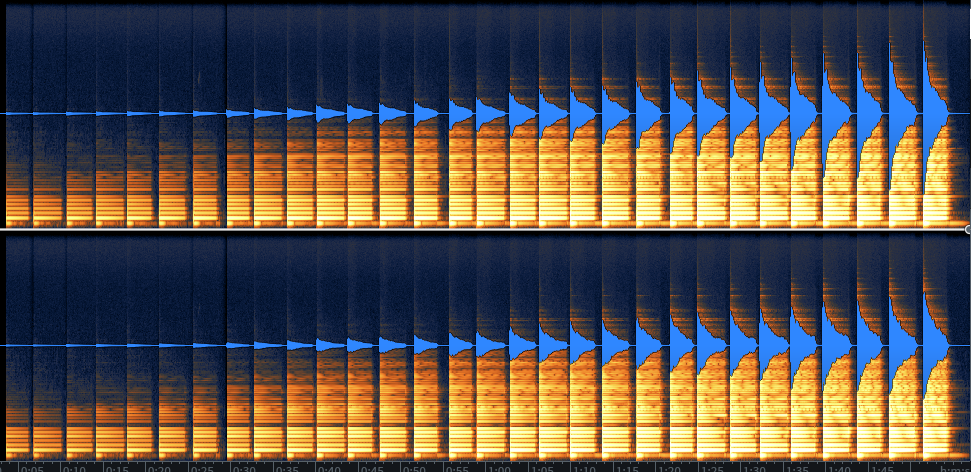
QuasiUnaFantasia dore_m Just to make sure I understand the diagrams correctly: the blue is the wave itself, and the golden stuff is a representation of the power spectrum with higher frequencies at the top, and lower frequencies at the bottom?
As @vagfilm said... Yes. Note I used a low note in this comparison, and it should be understood that the upper notes are more difficult to blend. Also, often you can hear the changes that are more difficult to see in these plots. Suffice to say that if you see it in the plots you will hear it. But sometimes you hear what you don't see immediately.
Rhodes74 Btw, did you calibrate the signals with some headroom? The partial white-outs at low freq/ high volume appear to indicate a saturation. But maybe i am misinterpreting…
That's a great point, and should definitely stay aware of that. I set up the mics with one gain and do all of the sampling with that gain so I can determine the entire dynamic range of the piano. If you record a live band, with unpredictable transients, you need to record with alot of headroom so you don't clip. But with a single piano key, you only need to make sure you don't clip at fff/pedal down across the keyboard. (I think I'm doing it right, please comment further if something sounds wrong).
The brightness on the plot is just a random contrast setting that I used, so it might be deceiving.
You can also see at the end (right side) of the Fazioli Plot, my Fazioli doesn't have damper sound releases (it's all dark). I can't wait to get back to that beast to record them. I swear, it won't take more than 2 minutes to record (but maybe 20 min to set up).
vagfilm Very interesting comparison (as always). Can you post your .mid file (I can create a new one, but the timings would be different)?
Btw, I am sure you mentioned this already but what do you use for these spectra? Izotope?
Sorry, I should have thought of that myself - it was getting late.
I use Izotope RX7. But for the spectral analysis and waveform view, you can just do it in Reaper for free (demo license). You just drag the wave file onto a track, highlight it, right click and hit spectral edit/show spectrogram. Not as pretty, and you can't edit the sound as easily as RX7.
dore_m you can just do it in Reaper for free (demo license).
Dore, the Reaper Wizard... No idea that Reaper could do that... Very helpful.
vagfilm Dore, the Reaper Wizard... No idea that Reaper could do that... Very helpful.
oh, hopefully that midi file was playing the correct C (second from lowest). Just made a midi output of what was left on my screen, and last night I was moving the note around to see how well the velocity increases were in different parts of the KB. In any case, if it's wrong, either let me know or just transpose to the correct note.
This is the amplitude and frequency plot for VSL Steinway D274 (I was unable to get both traces superimposed, and my spectrogram seems more blurred than yours. And I could not find any setting for spectral analysis in the Preferences). Anyway, for my untrained eyes, both the amplitude and timbre look to have a very smooth progression (with Steinway's unbridled low frequency dominance...)
@vagfilm Post me a wave or mp3 file and I can make a iZotope plot. I'm interested at seeing the vel curve compared to my other plots.
Here is the link to the WAV file:
https://we.tl/t-0B4ha3X3RW
Wow. That's very consistent. I have to ask @vagfilm , is this the default velocity curve? Because I have always thought that the VSL Steinway was especially bright, and you've told me before that a KB's velocity curve needs to be adjusted when using the D274. I can see what you mean, I think. The blue waveform increases more linearly than the others (especially from the midway point to the right). The other libraries are more parabolic. I think normally it should increase parabolically (inverse square law?). I think the graphs show that the loudness and brightnesses increase differently than the other ones.
VSL Steinway:
What I want to see is the VSL Fazioli. I want to see how bright the lowest velocity is - I sampled at around p and not ppp, and I wonder if I could have gotten a darker sound out of it if I had recorded the hammers barely touching the strings.
dore_m I have always thought that the VSL Steinway was especially bright, and you've told me before that a KB's velocity curve needs to be adjusted when using the D274. I can see what you mean, I think. The blue waveform increases more linearly than the others (especially from the midway point to the right). The other libraries are more parabolic. I think normally it should increase parabolically (inverse square law?). I think the graphs show that the loudness and brightnesses increase differently than the other ones.
That is an interesting graph and observations. Why would this be different from those of other VIs?
I'm reconsidering what I wrote. Last night I listened to the audio file that @vagfilm made, and I think he had his MIDI renderer at a slower BPM, so the audio file he provided is X times longer than mine. Thus the curve looks more flat. I still believe that VSL makes their source recordings as true to the instrument as possible, and with a robot, it should be dialed in. I guess that means that the particular Hamburg D274 was voiced particularly brightly.
My math/graphing brain is fuzzy - the MIDI file was time stretched, but the max attack amplitudes should be the same, and then I scaled the graph back to the same size to compare with the others. Should it still be parabolic? I'm flip flopping.
dore_m I think he had his MIDI renderer at a slower BPM
That is probably true because I happened to paste the midi file into an existing 40 bpm track (or maybe even 20bpm...). I was aware of that, but as far as I understand, it will not affect the output: lower bpm only increases the inter-note interval, not the spectral or peak amplitudes of the rendering. So, the only difference is that each note lasts longer. There should be no difference in the linearity of peaks progression.
Its great how I confuse myself. I agree.
@Jose EB5AGV , if you have time, can you render the VSL Fazioli and post a wave or MP3 file for me to analyze? Midi file is up in this thread:
Way back when, you mentioned that my Fazioli wasn't so great in the lower velocity range, and after re-visiting the Kontakt 'coding', I see I left a special EQ for you to darken the lower velocity range (it's bypassed by default). Now I'm wondering if VSL's lower range is just as bright.
This whole discussion is way over my head, but here is your MIDI file rendered with the VSL Fazioli - hope it's helpful:
Thanks for the mp3 jdg78
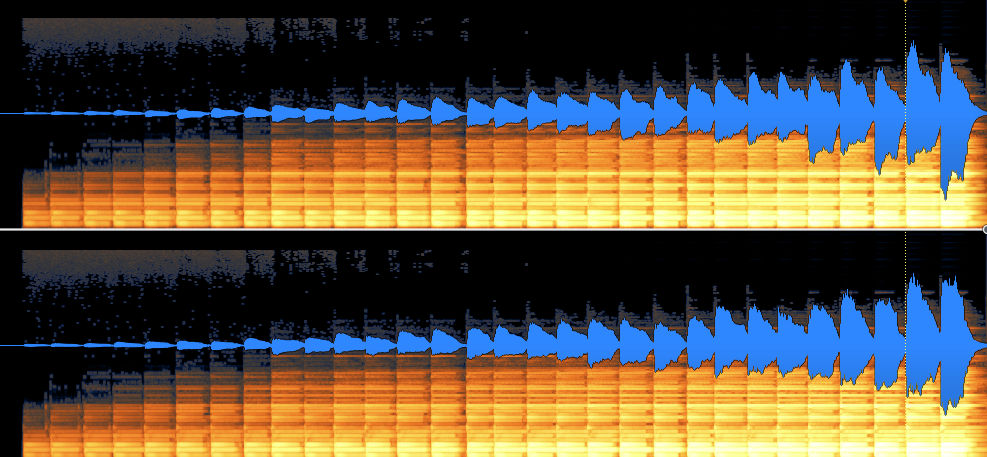
VSL Fazioli:
I'm wondering if the mp3 compression is causing a different spectral profile. There's much more black, indicating either they totally cut out noise (like I do sometimes) or the high frequency noise was taken out by the compression.
dore_m I'm wondering if the mp3 compression is causing a different spectral profile.
Well, here it is as a wav file: