
Skip to content

SFZ

dore_m

not to beat a dead horse, but here's Spitfire Audio's Janglebox piano (a $30 VST) that I won because of my PB contributions:

It's good for a character sound, but for piano playing, well, 'nuff said...

My VSL 30 demo license expired - when I activate another one, I'll post it, unless someone else wants to volunteer a wav/mp3 file - again - velocities increasing 4,8,12, 16,20, etc. Second C from the lowest. Post the wav/mp3 and I'll post the spectral analysis.

vagfilm

Very interesting comparison (as always). Can you post your .mid file (I can create a new one, but the timings would be different)?
Btw, I am sure you mentioned this already but what do you use for these spectra? Izotope?


QuasiUnaFantasia

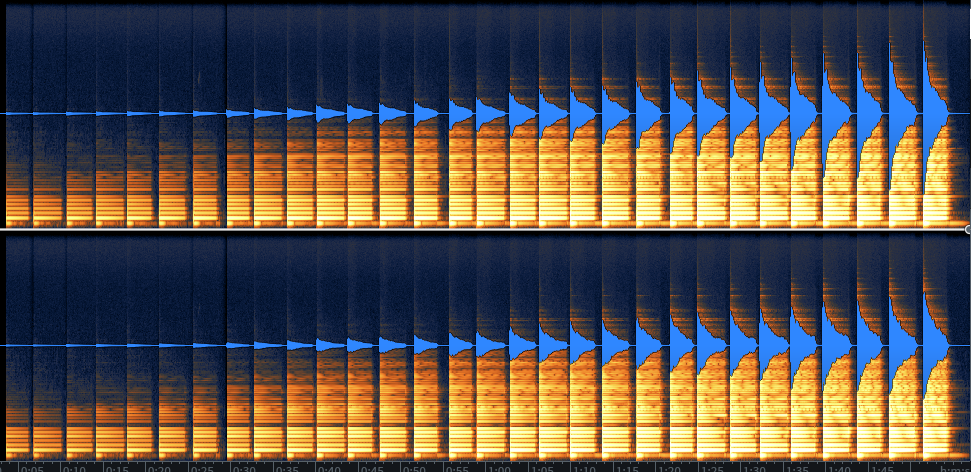
dore_m Just to make sure I understand the diagrams correctly: the blue is the wave itself, and the golden stuff is a representation of the power spectrum with higher frequencies at the top, and lower frequencies at the bottom?


vagfilm

QuasiUnaFantasia
Note @dore_m here, but you are correct. The pair of diagrams are the stereo channels (not really needed for this general velocity). Sudden changes in the pattern of golden horizontal stripes indicate sudden changes in timbre, while the blue peaks indicate amplitude/volume of the note.


Frédéric L

QuasiUnaFantasia One question that I ask myself is "how loud is a sound really?" Clearly, how loud a piano sound is must be related to which MIDI level it is associated with. But how do you measure loudness?

The MIDI specifications doesn’t propose a precise mapping between velocity (on a 1-127 scale) and the loudness. Then, no two virtual pianos behave the same. This explains that the VPC1 controller has some preset for 4 VST and a curve you can tweak to adjust to your VST. And many VST has also a curve which can be tuned to fut a given controller.

There are several loudness scale about digital signal : dBFS, LUFS. But only the relative loudness is important (dB between velocity 64 and velocity 96 for example). A louder VST can have its loudness normalised with the volume knob of the audio interface. Note also that the velocity control the loudness, but also the color/brightness of the sound. A loud note on a piano will involved more deeper hammer felt then will be brighter (then a single sample per note is not adequate).


Rhodes74

dore_m @Rhodes74 , that's a partial explanation of why the number of velocity layers don't matter as you mentioned on PW.

Et voilá, i knew you were hooked!
Btw, did you calibrate the signals with some headroom? The partial white-outs at low freq/ high volume appear to indicate a saturation. But maybe i am misinterpreting…

-Rhodes74


dore_m

QuasiUnaFantasia dore_m Just to make sure I understand the diagrams correctly: the blue is the wave itself, and the golden stuff is a representation of the power spectrum with higher frequencies at the top, and lower frequencies at the bottom?

As @vagfilm said... Yes. Note I used a low note in this comparison, and it should be understood that the upper notes are more difficult to blend. Also, often you can hear the changes that are more difficult to see in these plots. Suffice to say that if you see it in the plots you will hear it. But sometimes you hear what you don't see immediately.


dore_m

Rhodes74 Btw, did you calibrate the signals with some headroom? The partial white-outs at low freq/ high volume appear to indicate a saturation. But maybe i am misinterpreting…

That's a great point, and should definitely stay aware of that. I set up the mics with one gain and do all of the sampling with that gain so I can determine the entire dynamic range of the piano. If you record a live band, with unpredictable transients, you need to record with alot of headroom so you don't clip. But with a single piano key, you only need to make sure you don't clip at fff/pedal down across the keyboard. (I think I'm doing it right, please comment further if something sounds wrong).

The brightness on the plot is just a random contrast setting that I used, so it might be deceiving.

You can also see at the end (right side) of the Fazioli Plot, my Fazioli doesn't have damper sound releases (it's all dark). I can't wait to get back to that beast to record them. I swear, it won't take more than 2 minutes to record (but maybe 20 min to set up).


dore_m

vagfilm Very interesting comparison (as always). Can you post your .mid file (I can create a new one, but the timings would be different)?
Btw, I am sure you mentioned this already but what do you use for these spectra? Izotope?

Sorry, I should have thought of that myself - it was getting late.

I use Izotope RX7. But for the spectral analysis and waveform view, you can just do it in Reaper for free (demo license). You just drag the wave file onto a track, highlight it, right click and hit spectral edit/show spectrogram. Not as pretty, and you can't edit the sound as easily as RX7.

vel-increase.mid
326B

vagfilm

dore_m you can just do it in Reaper for free (demo license).

Dore, the Reaper Wizard... No idea that Reaper could do that... Very helpful.


dore_m

vagfilm Dore, the Reaper Wizard... No idea that Reaper could do that... Very helpful.

oh, hopefully that midi file was playing the correct C (second from lowest). Just made a midi output of what was left on my screen, and last night I was moving the note around to see how well the velocity increases were in different parts of the KB. In any case, if it's wrong, either let me know or just transpose to the correct note.


vagfilm

This is the amplitude and frequency plot for VSL Steinway D274 (I was unable to get both traces superimposed, and my spectrogram seems more blurred than yours. And I could not find any setting for spectral analysis in the Preferences). Anyway, for my untrained eyes, both the amplitude and timbre look to have a very smooth progression (with Steinway's unbridled low frequency dominance...)


dore_m

@vagfilm Post me a wave or mp3 file and I can make a iZotope plot. I'm interested at seeing the vel curve compared to my other plots.


dore_m

Wow. That's very consistent. I have to ask @vagfilm , is this the default velocity curve? Because I have always thought that the VSL Steinway was especially bright, and you've told me before that a KB's velocity curve needs to be adjusted when using the D274. I can see what you mean, I think. The blue waveform increases more linearly than the others (especially from the midway point to the right). The other libraries are more parabolic. I think normally it should increase parabolically (inverse square law?). I think the graphs show that the loudness and brightnesses increase differently than the other ones.

VSL Steinway:


vagfilm

dore_m I have to ask @vagfilm , is this the default velocity curve?

Yep. Default curve (ie, straight diagonal line). All testing is at default values.
I could also test the VSL CFX, but I don't have it currently installed (small SSD, sorry...).


dore_m

What I want to see is the VSL Fazioli. I want to see how bright the lowest velocity is - I sampled at around p and not ppp, and I wonder if I could have gotten a darker sound out of it if I had recorded the hammers barely touching the strings.


n-player

dore_m I have always thought that the VSL Steinway was especially bright, and you've told me before that a KB's velocity curve needs to be adjusted when using the D274. I can see what you mean, I think. The blue waveform increases more linearly than the others (especially from the midway point to the right). The other libraries are more parabolic. I think normally it should increase parabolically (inverse square law?). I think the graphs show that the loudness and brightnesses increase differently than the other ones.

That is an interesting graph and observations. Why would this be different from those of other VIs?


dore_m

I'm reconsidering what I wrote. Last night I listened to the audio file that @vagfilm made, and I think he had his MIDI renderer at a slower BPM, so the audio file he provided is X times longer than mine. Thus the curve looks more flat. I still believe that VSL makes their source recordings as true to the instrument as possible, and with a robot, it should be dialed in. I guess that means that the particular Hamburg D274 was voiced particularly brightly.

My math/graphing brain is fuzzy - the MIDI file was time stretched, but the max attack amplitudes should be the same, and then I scaled the graph back to the same size to compare with the others. Should it still be parabolic? I'm flip flopping.


vagfilm

dore_m I think he had his MIDI renderer at a slower BPM

That is probably true because I happened to paste the midi file into an existing 40 bpm track (or maybe even 20bpm...). I was aware of that, but as far as I understand, it will not affect the output: lower bpm only increases the inter-note interval, not the spectral or peak amplitudes of the rendering. So, the only difference is that each note lasts longer. There should be no difference in the linearity of peaks progression.


Next Page »